
B2B SEO case study: Canton Egypt went from zero organic visibility to 764 organic clicks and 26,121 Google impressions in eight weeks, September to November 2025, with no paid spend. 709 of those clicks, 92.8 percent, came from a single keyword. That concentration is the most useful finding here.

The verified result
Every figure below is read directly from the client’s Google Search Console property, September to November 2025. Nothing is modelled or rounded up. Where a number is a click, it is called a click.
| Metric | September 2025 | November 2025 |
|---|---|---|
| Organic clicks | 0 | 764 |
| Search impressions | 0 | 26,121 |
| Brand ranking | None | #1 for “Canton Egypt” |
| Competitor rankings in the niche | None | Still none |
| Paid spend | 0 | 0 |
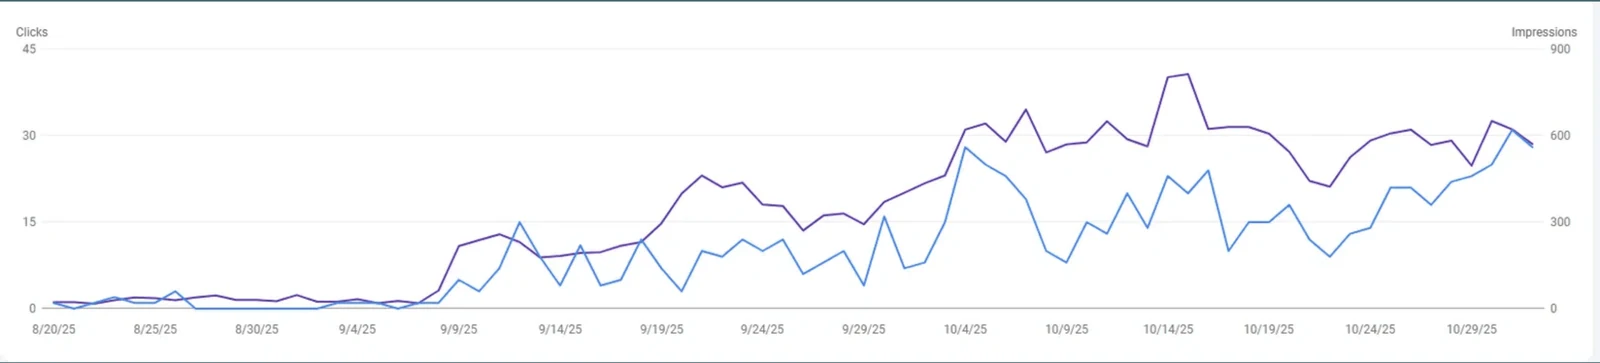
The shape matters as much as the total. Clicks sat flat at zero until 6 September and moved for the first time on 7 September. Growth ran steadily through September, stepped up sharply in early October, then held that level to month end, ending near its high rather than on a spike.
Two splits under the headline matter more than the headline. Mobile carried 83.8 percent of traffic at a 3.60 percent click-through rate against desktop’s 1.52 percent. And 64 percent of traffic came from MENA, exactly the geography the business sells into.
One correction, published deliberately. This result circulated internally as “764 organic leads”. It is not. It is 764 organic clicks. A click is a person who arrived. A lead is a person who identified themselves. Publishing the first number under the second word is the precise failure this practice exists to attack, so it is corrected here rather than quietly dropped.
Want the same read on your own numbers? Most firms have a Search Console property nobody has opened in a year. Before that is worth opening, it is worth knowing whether the commercial ground underneath it holds at all. That part takes two minutes.
What Canton Egypt actually sells
Canton Egypt is a China trade facilitator. It books business people from Egypt and the wider Middle East onto specific exhibitions in China. It helps them import what they need, commodities, technology and manufacturing equipment. And it keeps people on the ground in China who inspect goods before shipping, confirm the order matches what was sent, and make sure the process is properly completed. The service is the corridor itself, not any one product moving through it.
The engagement ran eight weeks, in three phases.
- Foundation, weeks 1 and 2. Technical groundwork, Google Search Console, and the keyword research that decided what the site would answer.
- Content, weeks 3 and 4. The pages built against the query that research identified.
- Performance, weeks 5 to 8. Monitoring, refinement, and compounding the position once it began to hold.
That is the whole of it. Eight weeks, one site, no paid spend. What makes the result worth reading is not the volume of work, it is which question the work answered.
The system decides the channel: SEO, AEO, LinkedIn, paid ads. Here it chose organic search, because the buyer was already searching and nobody had answered them.
The three pillars the strategy actually stood on

1. Mobile first, because the buyer is on a phone
83.8 percent of traffic arrived on mobile, and mobile out-clicked desktop by 2.37 times. In MENA B2B this is normal and still routinely designed around rather than designed for. A desktop-first page loses most of the audience at the layout stage, before a single ranking factor is in play.
2. Geographic concentration, not geographic reach
64 percent MENA, 29 percent Egypt, 11.4 percent Saudi Arabia. Nobody tried to rank globally. The business serves a specific corridor between the Middle East and China, so the content targeted that corridor. Reach that lands outside your serviceable market is a cost, not an achievement.
3. One high intent query, captured before anyone else showed up
The keyword research surfaced what buyers were actually typing, and it was not the category. It was a scheduling query: when are the exhibitions. That looks informational and is not. Someone checking the China exhibition calendar is deciding whether to travel, and travelling to those exhibitions is exactly what Canton Egypt sells.
The winning keyword was the business model typed into a search box. That is the whole finding, and it is why no competitor had a page for it: everyone else was writing about sourcing from China, which is the category. Nobody was answering the question the buyer asks first.
Why 709 of 764 clicks came from one keyword
The single keyword “China Exhibitions Schedule 2025” produced 709 clicks. That is 92.8 percent of everything. Most agencies would present the 764 and let you assume a healthy portfolio.
Here is the honest reading, in both directions.
What it proves. Finding the one query your buyer actually types beats producing fifty pages for queries they do not. The win was diagnostic, not editorial.
What it risks, and this is the part to read twice. The autumn 2025 Canton Fair ran from 15 October to 4 November across three phases. The traffic curve stepped up in the first week of October, roughly two weeks before the doors opened, and held its level through the fair. That is buyers planning travel, which is exactly right. It also means the demand is seasonal by construction: the fair happens twice a year, so the curve repeats twice a year and thins out in between.
Worse for anyone wanting a clean story, the reporting window closes on 1 November, inside the fair. Nobody has shown you what happened after it ended, because the data stops there. A single-keyword, twice-yearly, year-dated result is a real result and a single point of failure at the same time. Treat 92.8 percent as a warning label attached to a good outcome, not as a trophy.
Concentration is easy to detect and easy to ignore. If one page or one query is carrying most of your organic traffic, you have a dependency, not a channel. Whether that dependency is worth fixing depends on things no traffic chart will show you.
How this compares to the other verified results
One case study is an anecdote. The pattern only means something across engagements sharing nothing but the method.
| Engagement | Market | Verified result |
|---|---|---|
| Eco Clean KSA | Saudi Arabia, B2B and B2C cleaning | SAR 77,483 organic revenue, 2.11M impressions, 23,000 organic clicks, zero ad spend |
| Smile Pharmacy NJ | United States, pharmacy | 429 percent organic click growth, 3,132 percent impression growth, four number one rankings, four months |
| Mis Egypt Travel | Egypt, inbound travel | 2,450 organic clicks, 137,000 impressions, average position 4.9, plus 82 ChatGPT referral sessions in GA4 |
| Canton Egypt | Egypt, China trade corridor | 764 organic clicks, 26,121 impressions, eight weeks, 92.8 percent from one query |
Canton is the smallest number on that table and the most instructive, because it is the only engagement that started before the market existed for the client. The other three had demand already flowing to competitors. Canton had nothing to take share from.
If you are running a SaaS SEO case study comparison or an enterprise SEO case study comparison across vendors, the question worth asking is not which agency produced the largest percentage. It is which one can show you the query that produced the result and explain why they chose it. A percentage with no query behind it is a chart, not a method.
What this actually proves about order of work
The lesson is not the volume of pages. It is that the eight weeks were spent answering a question the buyer was already asking, rather than the question the category assumes they ask.
Most content is written against the category term. Importing from China, sourcing from China, freight from China. Those describe the industry. They are not what a buyer types when they are deciding to act.
The buyer types the operational step in front of them. Here that was the exhibition schedule. It sits one move earlier in the decision than the category term, and it was unclaimed.
Unclaimed is the whole opportunity. Zero competitor rankings in the niche meant the position was taken rather than won from anyone, which is why eight weeks was enough.
The order that matters is research before production. Weeks 1 and 2 decided what weeks 3 and 4 would write. Reverse those and you produce volume against a query nobody uses.
The international SEO lesson: the query is local even when the buyer is not
Read as an international SEO case study, the transferable finding is narrow and useful. Buyers crossing a border search for the operational step in front of them, not for the category they will eventually buy in. Nobody types the name of the industry you have decided to call yourself. They type the thing they are trying to do this week.
For a US or European vendor entering the Gulf, the equivalent mistake is to build a page for the category and wait. The winning page is usually the procedural question sitting one step earlier in the buyer’s week, and it is almost always unclaimed.
The Decision Brief covers one of these decisions a week, written for the person who signs rather than the person who executes. Subscribe on LinkedIn.
From clicks to conversations, and why this is not a lead generation case study
This page is not a B2B lead generation case study, and it should not be read as one. Search Console measures clicks. It does not measure enquiries, quotes, meetings or contracts. Attributing revenue to this work would require CRM data that is not in evidence, so no revenue claim is made.
What can be said is structural. 764 people arrived on a property that had no visitors eight weeks earlier, 64 percent of them from the exact region the business serves, at a moment when they were deciding whether to travel to an exhibition that Canton Egypt exists to get them to. Organic search put them on the site. What happened after that is not in this data.
Any agency presenting click counts as leads is either careless or counting on you not to check. Ask for the definition before you accept the number.
Frequently asked questions
What exactly did Canton Egypt achieve in eight weeks?
Between September and November 2025, Canton Egypt went from zero organic search visibility to 764 organic clicks and 26,121 search impressions, verified in Google Search Console, with no paid advertising spend. The brand reached number one for its own name, “Canton Egypt”. Mobile carried 83.8 percent of traffic at a 3.60 percent click-through rate, against 1.52 percent on desktop. 64 percent of traffic came from the MENA region, led by Egypt at 29 percent and Saudi Arabia at 11.4 percent. The single largest contributor was one keyword, “China Exhibitions Schedule 2025”, which produced 709 of the 764 clicks, or 92.8 percent of the total. The niche carried no competitor rankings at all during the period, so the position was taken rather than won from anyone.
Is 764 clicks a good result for a B2B SEO case study?
On its own the number is small. In context it is significant for three reasons. The property started at zero, so there was no existing baseline to grow from. It took eight weeks, not eight months. And it happened in a niche with no competitor rankings at all, which means the ceiling has not been tested. The right comparison is not against a mature site’s monthly traffic, it is against what the same eight weeks would have produced with paid media and no organic asset left behind at the end. Judge a B2B SEO case study by the starting position and the time to first result, not by the absolute number.
Why publish the 92.8 percent single-keyword concentration instead of hiding it?
Because it is the finding. The result did not come from producing volume, it came from identifying the one query the buyer actually types and getting there before anyone else. Concealing the concentration would make the work look like broad organic dominance, which it is not, and would remove the only genuinely transferable lesson on this page. It is also a real risk that any buyer of this service deserves to see: a single-keyword result is a single point of failure, and a year-dated seasonal term will decay. A case study that only shows the flattering half is marketing, not evidence.
Were the 764 clicks leads?
No. They were clicks. A click is a visit from Google search. A lead is a person who has identified themselves and expressed interest. This result circulated internally under the wrong word and is corrected here. No revenue figure is claimed for this engagement because the CRM data required to support one is not in evidence. The distinction matters commercially: an agency that reports clicks under the word leads is inflating its result by a factor nobody can audit, and the buyer usually only discovers the gap at renewal. Ask any vendor to define every number in their case study before you accept it.
Can this be repeated in another market?
The method transfers, the numbers do not. What repeats is the order: research the query before you produce the pages, and target the operational step the buyer is actually at rather than the name of the category. What does not transfer is the eight-week timeline or the 92.8 percent concentration, both of which depended on a niche with zero competitor rankings. In a contested market the same method takes longer and the traffic spreads wider, which is healthier but slower. Expect three to six months rather than eight weeks.
What was left unbuilt?
More than fifty supporting keywords were identified and never developed. The English-language market beyond the single winning query was untouched. The wider GCC opportunity was mapped and not pursued. No backlink authority work was carried out, which means the domain’s ability to compete on harder terms was never built. The eight-week figure represents the first move in the market, not the market’s ceiling. Nor was any conversion infrastructure built on the site itself: no lead capture, no enquiry routing, no measurement of what happened after arrival. That omission is the reason this page can report clicks and cannot report leads, and it is the first thing that would be fixed if the engagement were running today.
How do I tell whether my own organic traffic has the same concentration risk?
Open Google Search Console, set the date range to the last three months, sort queries by clicks and look at what share of total clicks the top query holds. Above roughly 40 percent, you have a dependency rather than a channel. Then check whether that query is dated, seasonal or tied to a single event, because those decay on a schedule you do not control. Google documents the report at Search Console Performance reports. The check takes about ten minutes and it is the single most useful thing most firms are not doing. If the answer worries you, the fix is not more content. It is identifying the two or three adjacent queries your buyers use at other points in the same week and building for those, so the traffic rests on several legs instead of one.
If you are entering a market rather than defending one
The Canton Egypt result came from doing the diagnosis before the production. Most engagements that fail did it the other way round. If you are opening a new market, or you have been in one for a year and cannot say which query your buyers actually use, start with the diagnosis rather than the pitch.
Take The Growth Qualifier, fifteen questions, two minutes Read how the Commercial Growth System decides which channel to use